

Inspecting a run
Click any node to open the inspector. It shows what that node actually received and produced — not a rendered summary, the values themselves.
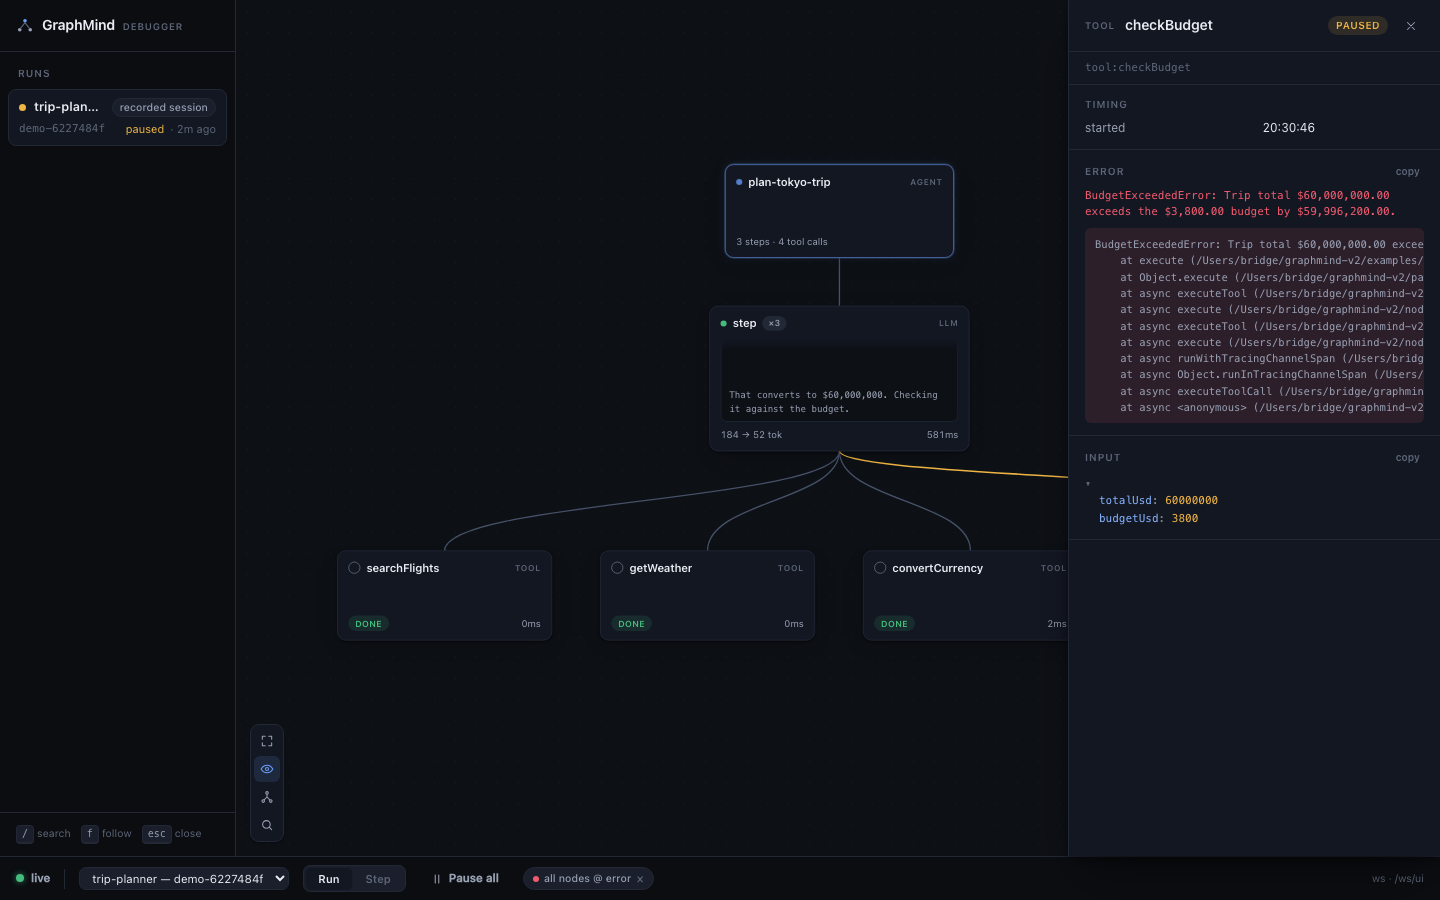
What a node shows
Section titled “What a node shows”| Field | Detail |
|---|---|
| Input | Tool arguments, or the messages and settings going into a model step. A value hidden by a GRAPHMIND_HIDE_* switch shows as a “hidden by …” chip. |
| Output | The return value, or the model’s completion |
| Error | name, message and stack when the node threw |
| Duration | How long the code ran. Once a gate has held the execution, the inspector splits it into ran and held; see durations. |
| Usage | inputTokens / outputTokens on LLM nodes |
| Status | ok, error or aborted |
| Instances | Every execution of this logical node, newest first |
Inputs and outputs render as an expandable JSON tree, so a large tool result stays navigable instead of becoming a wall of text.
Instances: the same node, many executions
Section titled “Instances: the same node, many executions”One node on the canvas can hold many executions. A retrieval tool called eleven times is one node with eleven instances — select an instance to see that call’s own input, output, duration and usage.
This is the payoff of stable node ids. You are looking at one place in your code and its
history, which is almost always the question you actually have (“what did searchOrders get
called with, across this run?”).
Streamed tokens
Section titled “Streamed tokens”Model nodes accumulate their stream live. Deltas arrive batched (roughly 30 per second per node, so the UI stays smooth on a fast provider) on three channels:
| Channel | Contents |
|---|---|
text | The visible completion |
reasoning | Reasoning / extended-thinking output where the provider exposes it |
tool-args | Tool arguments as the model streams them |
Watching tool-args stream is often the fastest way to see a model committing to a bad call —
you can have a breakpoint on that tool waiting before it finishes writing the arguments.
Usage and cost
Section titled “Usage and cost”node.finished on an LLM node carries TokenUsage — inputTokens and outputTokens as
integers. The viewer shows them per step and rolled up for the run, which makes the “why did
this run cost eleven cents” question answerable in one look: usually one tool returning a huge
blob that gets re-sent on every subsequent step.
Live vs. history
Section titled “Live vs. history”The inspector works the same on a finished run. Pick any run from the run picker and read it node by node; the whole event stream is persisted in SQLite. The only difference is that a finished run has nothing to resume.
If you attach mid-run, the client replays its ring buffer (5,000 events by default in TypeScript, 2,000 in Python and Ruby) oldest-first
with the original sequence numbers, so you get the history you missed and the viewer
deduplicates on (runId, seq).
Finding a node quickly
Section titled “Finding a node quickly”⌘K opens the command palette: fuzzy-search every node in the run by name, hit Enter, and the canvas centres it with the inspector open. The full UI map is on the viewer page; for the wider strategies — collapsing, filtering, long-running runs — see big & long-running graphs.
Reading a run from your coding agent
Section titled “Reading a run from your coding agent”Everything the inspector shows is also available over MCP, so Claude Code or Cursor can pull up the failing run and reason about it with you:
claude mcp add graphmind -- npx graphmind-ai mcplist_runs, get_run, get_node and find_errors read the SQLite database directly — they
work with the viewer closed. See the MCP reference.